BOARD DASHBOARD
This dashboard provides a snapshot of the previous month's metrics for Gulf Shores & Orange Beach Tourism and Alabama's Beaches Sports & Events. Using the dashboard:
- Click the down arrow on the right to expand and review the metrics for each section.
- The dashboard defaults to the previous month’s results. Use the date-picker in the upper right of each section to view a different period (year, quarter, or month). Selecting YTD Edge populates data as of the previous day.
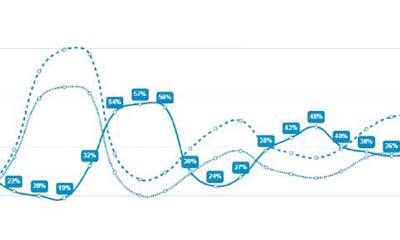
- All graphs are interactive. Hover over each entry to display the individual data, or click the chart icon to display the data in chart form. Customize the data view by clicking the x-axis labels or legend to toggle elements on or off. Tiles are not interactive.
- To enlarge the graphs, click the arrow icon in the upper right corner of the graph window.
- Data sources differ for each category; many are updated only at the month's or quarter's end. Note: When viewing data from previous years, some results may reflect only the initial data.
- Data is aggregated from numerous sources, including GA4, Key Data, Arrivalist, STR and Looker Studio.


